The Reporting Module is designed as an aid for user to create reports out of screenshots, tables and charts.
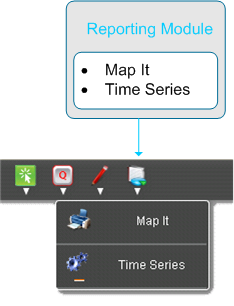
It consists of two parts:
- Map it controls the screenshot output for current map selection, including the option to print legends also.
- Time Series manage the query and visualization for the time series data. The expected results will be available as charts or table. To use the result for presentation and further research it is possible to print the result as graphic or export the data as csv-file in order to use the data in Microsoft Excel or other spreadsheet software.
Map it
Map it create a pdf with the map in the given extent and with all visible layers in a predefined layout. If required, it is possible to add the legend to the layout.

Time Series
Time Series contains three available predefined queries with different variations to query TimeSeries-tables. The results are shown as charts and table. To use the results for presentation and further research it is possible to export charts as graphic and tables as csv-file.
